
Worked across engineering teams to isolate customer/developer/QA environments, automate testing in CI pipelines, and increase deployment confidence for Q2 Software’s Helix organization. This included writing tools for load testing and data population, as well as self-service tools that allowed developers to stand up the infrastructure and services for a fully featured environment in less than 15 minutes.

Developed consumer and back-office financial technology products for Q2 Software, including personal financial management and person-to-person payments.
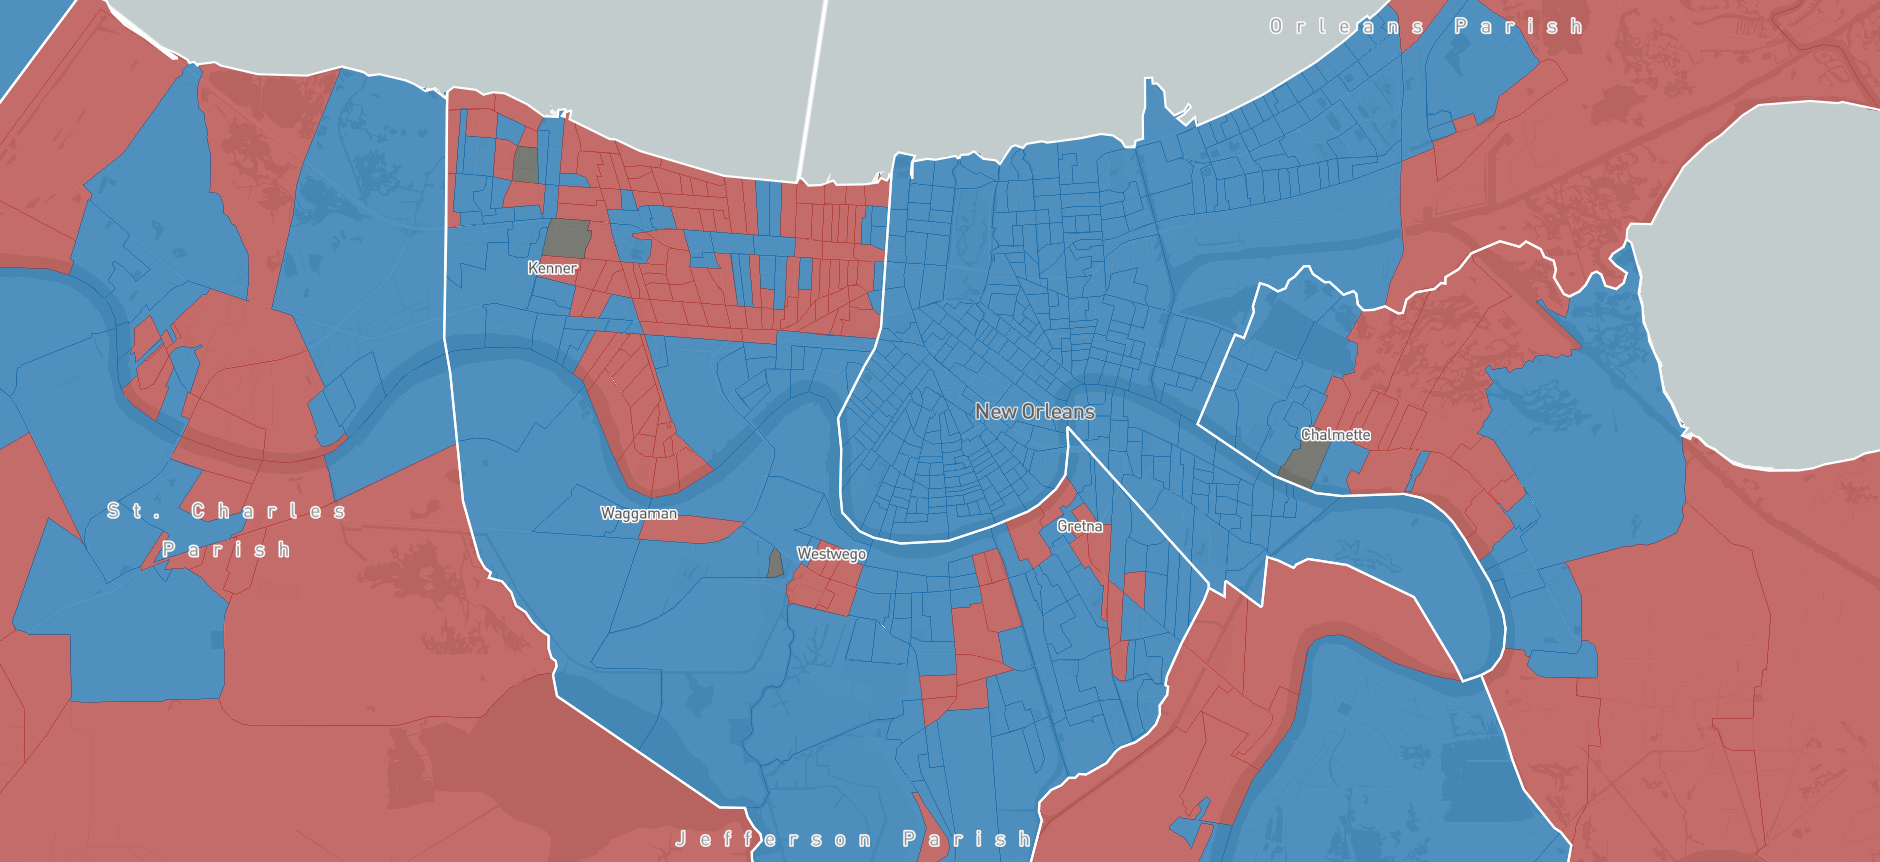
Live election results for Louisiana using precinct-level maps. This required aggregating precinct GIS files from state and parish offices before correlating the maps with precinct-level results from the Secretary of State. On election night, data processing scripts sent results to the front end for constantly updating tables and maps.
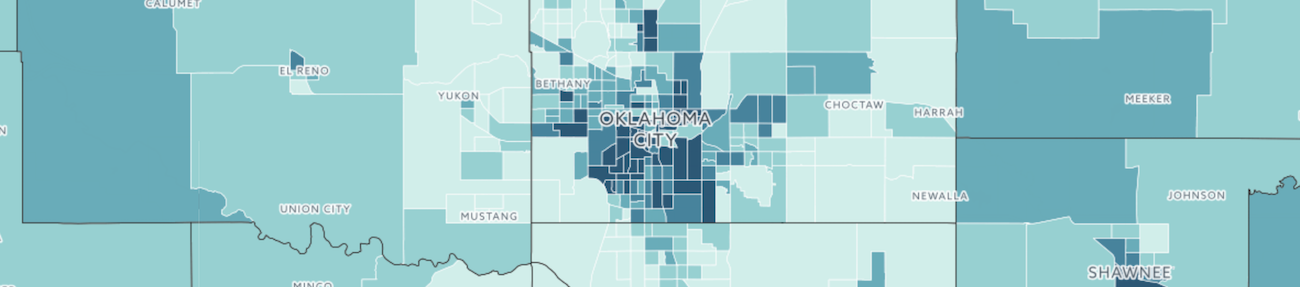
Examining poverty rates across Oklahoma’s census tracts.
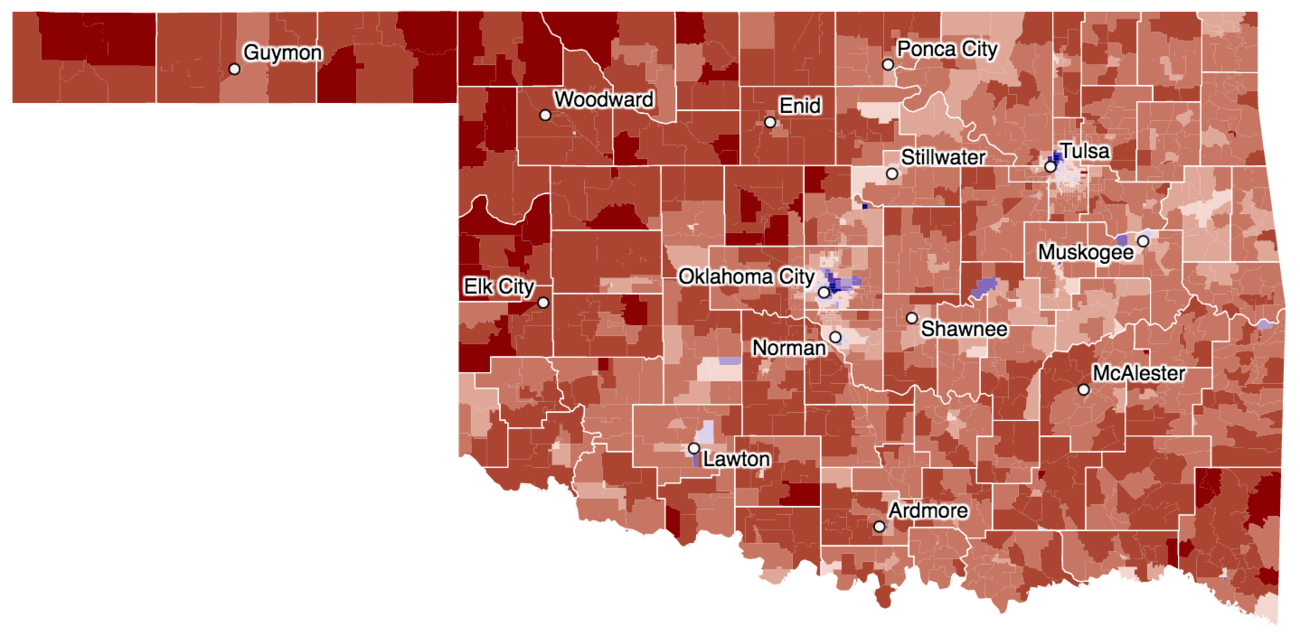
Election results analysis for Oklahoma’s presidential race and state questions.
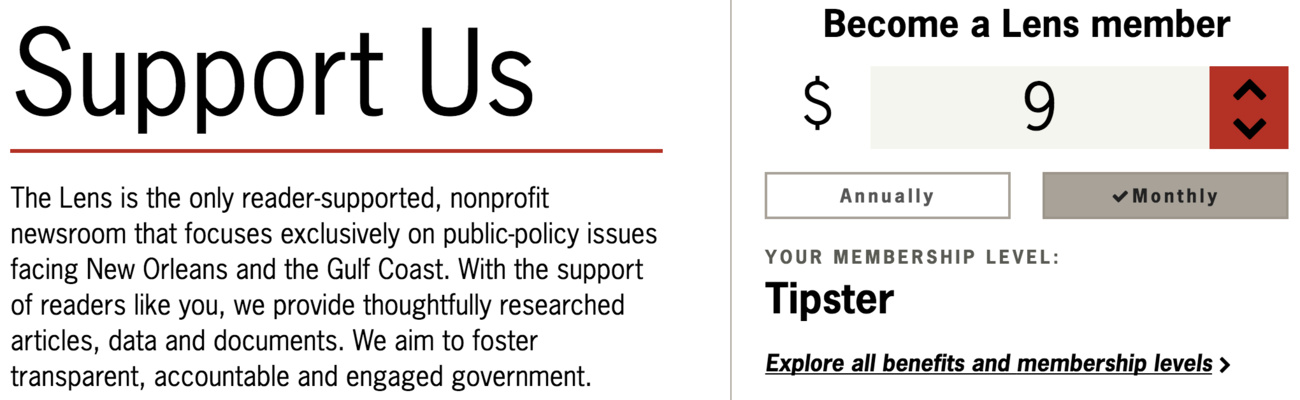
Combined Stripe payment processing and Salesforce donor tracking for a donation system for The Lens. The Lens used this page to accept online donations from 2016 to 2019.
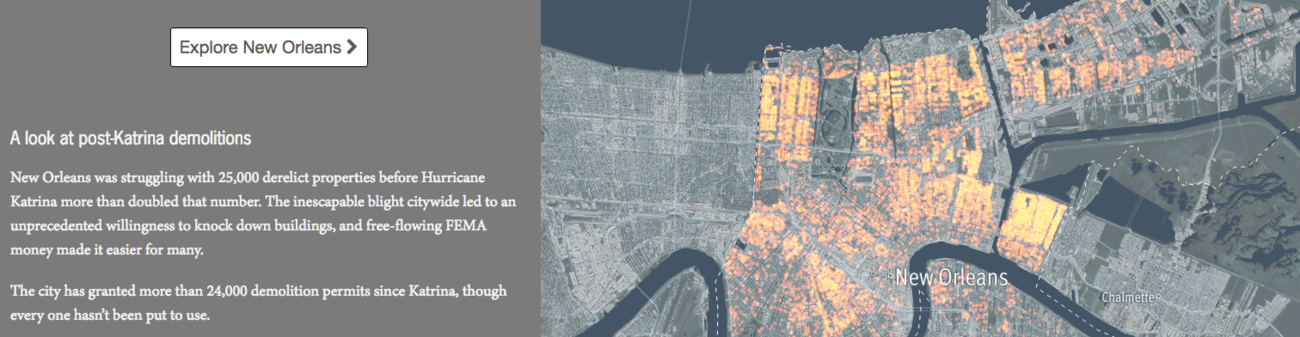
This project combined text, photos, and interactive design to present the stories of planned and unexpected demolitions in New Orleans following Hurricane Katrina. The project drew on FEMA databases, archived photos, and on-the-ground reporting.
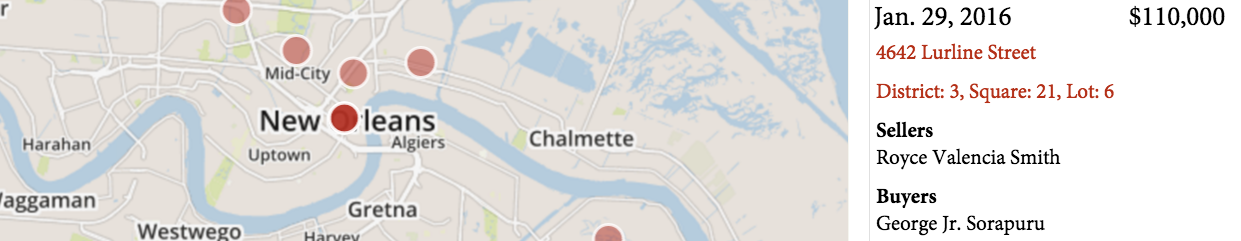
A web scraper that downloaded New Orleans property sales and a web application that made the archive searchable and visible on a map.
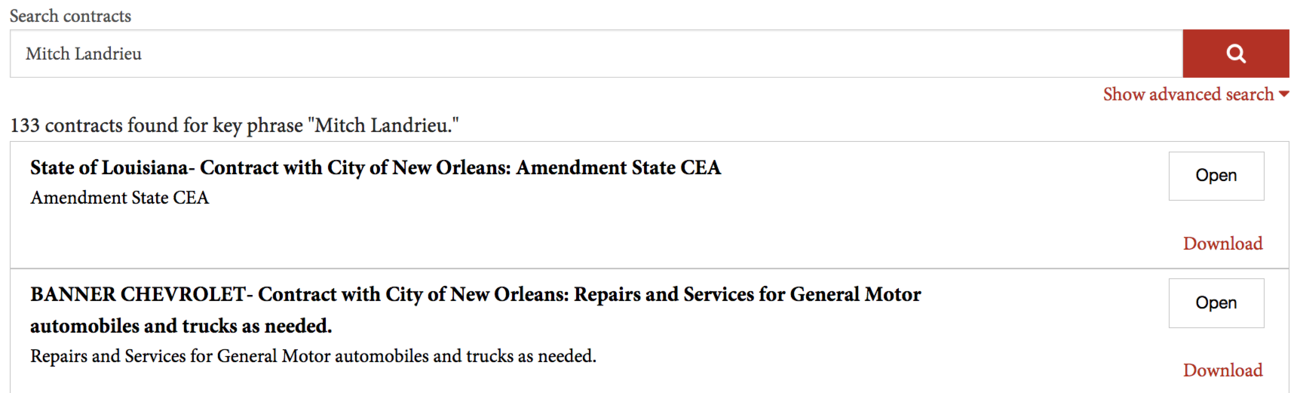
A web scraper that downloaded the City of New Orleans’ contracts and a web application that allowed users to search the archive.

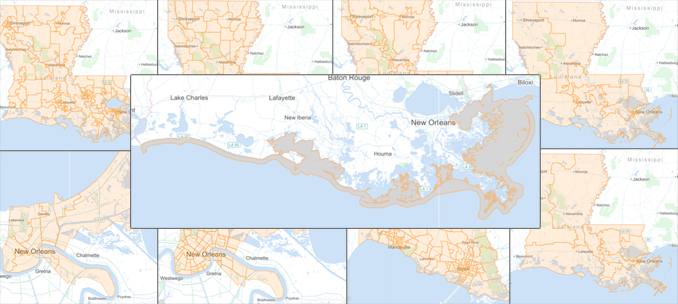
This is a fully scripted geographic data-processing pipeline for Louisiana and New Orleans. It combines a Makefile and command-line tools to download and convert raw geographic data into Shapefile, GeoJSON, and TopoJSON file formats. This was created to eliminate duplicate work and increase development speed for new graphics.
A collection of data visualizations I have created while practicing D3 and Adobe Illustrator.
Erin Skarda and I discussed our experiences with hiring and including developers in newsrooms. We talked about why they are important, why they are worth the investment, and how they can boost the newsroom. Slides. Tipsheet.
A hands-on workshop teaching Google Fusion Tables. Tipsheet.
The introductory portion of a three-part series of hands-on workshops taught by me, Ron Campbell, and T. Christian Miller. This tipsheet covers my portion of the series. Tipsheet.
A presentation arguing the case that journalists should continue to advance their data skills even when they are proficient at Excel. Slides.
Abe Handler, Todd Wallack, and I presented some of our favorite notification tools that assist our reporting and shared the stories that they yielded.
- Interactive graphic (2017-2019)
- Election coverage (2017)
- Digital innovation (2016)
- Web graphics (2016)
- Investigative reporting (2014)
- Multimedia element (website) (2013)